
The Tooth Chart
Aug 30, 2024
When I taught Year 1/2 one of the things that captured every student’s interest was...teeth!
It is about that time in a child’s development when baby teeth begin falling out with increased frequency.
For some it is a long, slow process. For others it is a process that happens so quickly it leaves them with a smile that would make any school photographer chuckle!
As a teacher, we are always on the lookout for contexts that will engage our students. For 6-8 year olds, there is nothing better than the excitement of a tooth falling out!
I was recently reminded of the ‘high pressure’ slow teeth can generate by my 7 year old daughter. She was the last student to lose a tooth in her class!
She waited and waited, patiently at first, but, there are only so many times you can hear “Look! Another one of my teeth has fallen out!” before even the most relaxed 7 year old will start to feel the pressure!
These were some of our conversations:
Miss 7: Mum, maybe there is something wrong with my teeth?
Me: No there is nothing wrong with them, they are just on their own timeline.
Miss 7: Mum, but EVERYONE has lost a tooth and even some of the Preps have
Me: It will happen, I promise, they are just not ready yet!
Miss 7: Mum, I am the last… maybe we should go to the dentist.
Me: The dentist will say exactly the same as me… just wait patiently!
At this point I decided it was time to pull out my 1982 contacted copy of “Molly and the Slow Teeth” by Pat Ross. I remember my mum reading me this book, and I remember reading to my Year 1/2s. It is an ‘oldie but a goodie’ and has been embraced enthusiastically by every 6 and 7 year old I have read it to, without fail!
When I taught Year 1/2, inspired by ‘Molly and the Slow teeth’, we decided to begin a ‘tooth chart’ (see below).
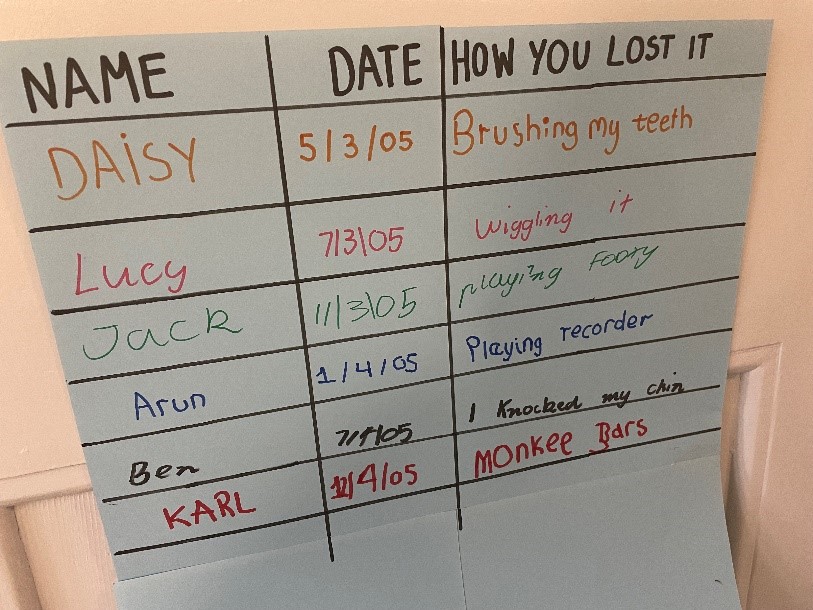
We set up a table and collected data on when where and how teeth fell out for everyone in the class. The pride my students felt having lost a tooth AND getting to record it on the tooth chart was palpable!
The tooth chart provided a wonderful cumulative data source that led to many informal data related discussions.
We discussed:
How long since your last tooth fell out? (time)
How many teeth have fallen out altogether in our class? (counting)
Who has had the most teeth fall out? (data interpretation)
Who has had the least teeth fall out? (data interpretation)
What is the most common way for teeth to fall out in our class? (data interpretation)
Sometimes in maths we feel ‘pressure’ to get through the curriculum. But if you just look around, you will see authentic opportunities to cover curriculum in simple ways with your class. You don’t always have to do a ‘lesson’ to cover content, a simple tooth chart can lead to some wonderful ongoing data interpretation discussions that will allow you to address the curriculum requirements in a much more streamlined manner.
Ange🎲🎓
P.S. You can download the PDF version of this blog to print or share with colleagues here.
