
Which counting chart is best?
Feb 20, 2025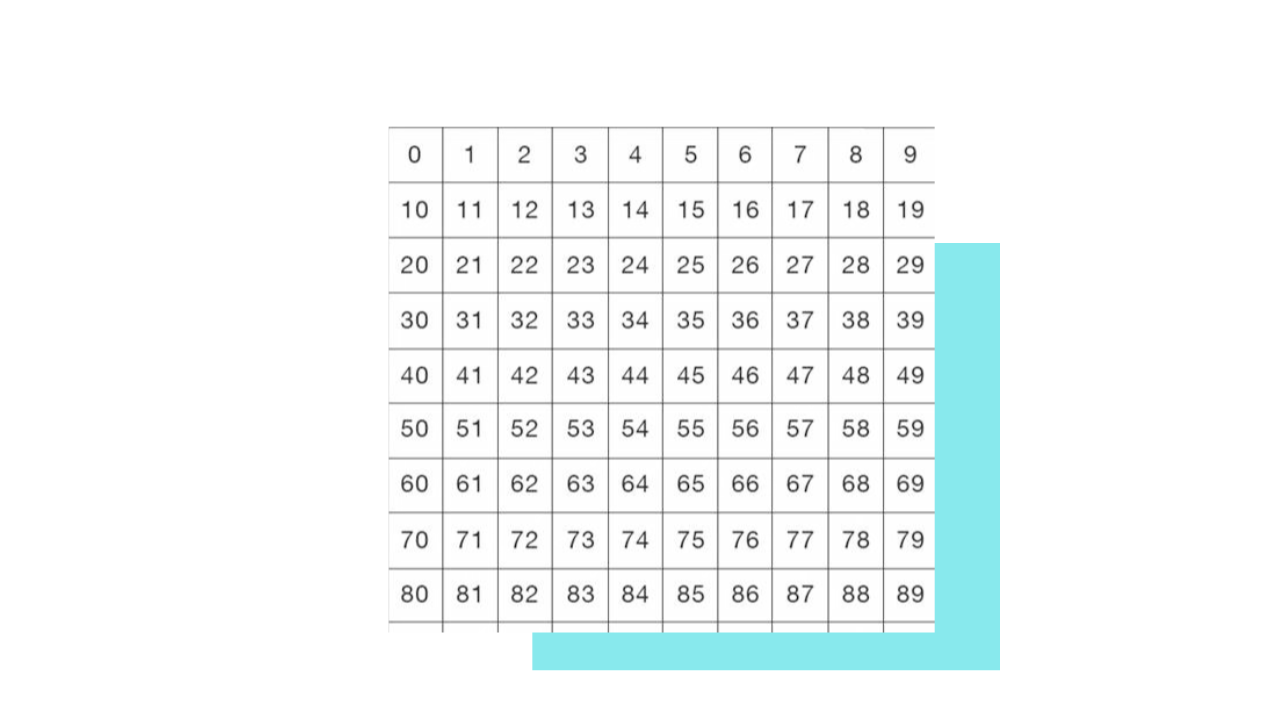
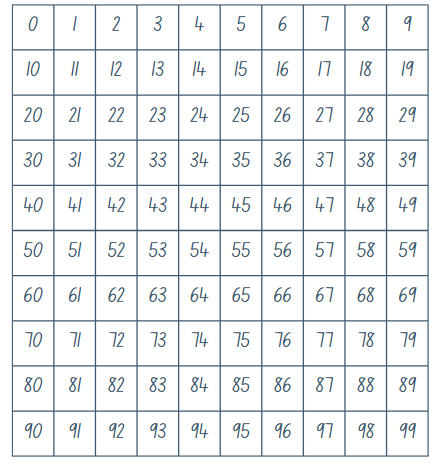
I often receive emails from teachers and Numeracy leaders within my Numeracy Teachers Academy asking questions about classroom resources. Recently a school was having a debate about the best counting chart to use in their Year 1 class a 1-100 or 0-99 chart.
There were differing opinions within the group, so they asked me to share my thoughts. In this week’s blog I present some considerations.
For me it comes back to us carefully considering what we are wanting students to attend to by using a counting chart.
Usually, the purpose of a counting chart is as follows.
- To provide a visual representation of the number sequence allowing students to keep track or read the numerals as we practice verbal counting.
- To allow students to notice counting patterns within the number sequence.
As I look at almost everything through a ‘place value’ teaching lens, I consider there to be another important function of a counting chart (one that is often overlooked).
A counting chart provides a great opportunity to explore and highlight the pattern we follow when we represent our numbers in the base 10 place value system.
When exploring our counting system, I think it is critical we explore the sequence alongside the counting of actual collections of items. After all, this is why place value was invented, to allow humans to efficiently and accurately record large collections of things.
Through counting objects, we can help students to see the importance of grouping in tens, and we can then explicitly show them how that grouping is represented on a counting chart.
Often we use the counting chart as a representation of the number naming sequence (basically a list of numbers), which in essence it is- but it can also be a powerful representation of our place value recording system if we help our students to attend to this feature.
In our base 10 place value system, every time we count 10 ones we rename these as 1 ten.
So 1,2,3,4,5,6,7,8,9 then we form a group of ten.
We represent that group of ten by recording a ‘1’ in the tens column and placing a ‘0’ in the ones column to show there are no ones.
Then, we can continue to count another group of ten.
But we must have the ‘1’ in the tens column to indicate we already have counted 1 group of ten. As we count the next group of ones, only the ones column changes.
11,12,13,14,15,16,17,18,19…
At this point, we can form another group of 10. Now we have 2 tens.
We represent 2 tens by recording a ‘2’ in the tens column and showing that we have 0 ones- so 20.
The English number naming system unfortunately adds another layer of complexity as instead of calling this 2 tens, we need to say 'twenty' (don't even get me started on the teen numbers🤦♀️). I think this is where we can sometimes get sidetracked on counting charts, because we tend to over-focus on the number names, rather than using them as an opportunity to explore what the numbers are representing (we need to do both, but I think the latter is often overlooked).
Then, we can continue to count another group of ten.
But we must have the ‘2’ in the tens column to indicate we already have counted 2 groups of ten. As we count the next group of ones the ones column changes.
21,22,23,24,25,26,27,28,29…
You may be reading this thinking…’Ange I think we all understand this’...and I fully expect you do, but sometimes our expertise bias gets in the way of us seeing how difficult this is for students who have never experienced a place value system to understand.
Sometimes we are so focused on helping students to learn the number naming sequence, we forget to explicitly show them how our system actually ‘works’.
One of the investigations I love to do with older students and teachers who are proficient in whole number place value is looking at different place value bases. It is through this that I believe we come to fully understand and generalise our place value system understanding.
If we take Base 4 as an example, this would be the example of a counting chart:
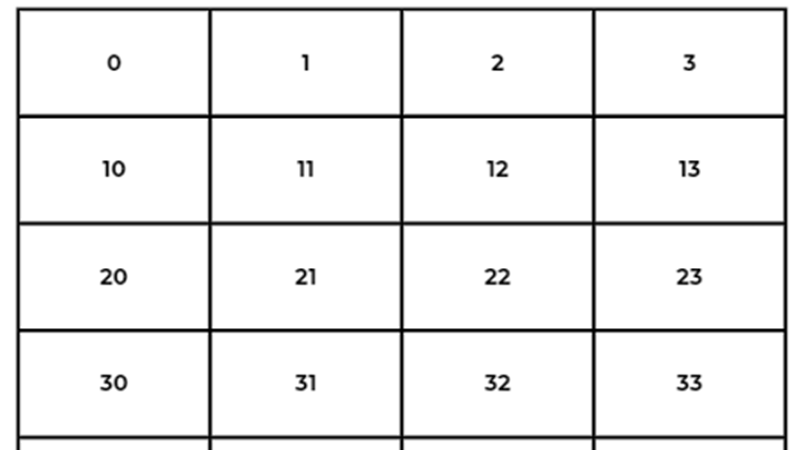
In Base 4 we group in fours.
So, if we are counting it would be:
1,2,3…
If we add one more item, at this point, we can form a group of 4. Now we have 1 group of 4.
We represent that group of four by recording a ‘1’ in the ‘fours’ column and placing a ‘0’ in the ones column to show there are no ones. So the numeral would be ‘10' (not ten as that is the name we give this numeral in base ten. We could call this one-zero base 4)
Then, we can continue to count another group of four.
11, 12, 13… then we form another group of four.
We represent that group of four by recording a ‘2’ in the fours column and placing a ‘0’ in the ones column to show there are no ones. This numeral would be ‘two-zero base 4’
Then, we can continue to count another group of four
The purpose of me using this Base 4 example is to put you back in the shoes of a novice learner. Presumably you are not an expert in Base 4, so looking at the Base 4 counting chart is a new experience.
When you look at this chart, does it make sense?
For me, it makes sense to show the new group on a new line… so
1,2,3
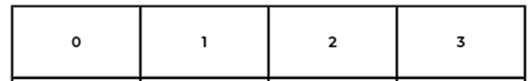
Then 1 group of 4 (on the next line)
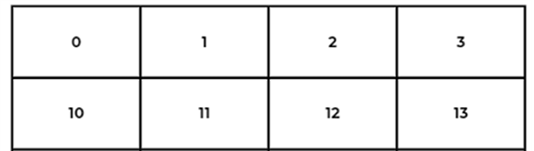
1group of 4, 1 group of 4 and 1 one, 1 group of 4 and 2 ones, 1 group of 4 and 3 ones…
Then 2 groups of 4 (on the next line)
2 groups of 4 and 1 one, 2 groups of 4 and 2 ones, 2 groups of 4 and 3 ones... then
3 groups of 4 (on the next line)
Having the new group on the new line makes the action of grouping very clear…
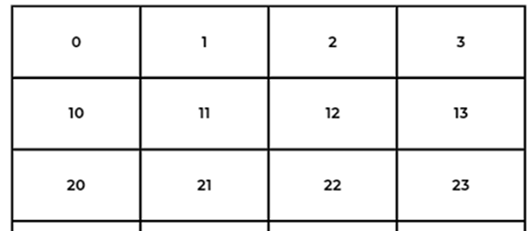
If we think back to our base ten chart… can you to recognise that starting at 0 a allows the grouping pattern of base ten to be seen.
When we get to 19 (1 group of ten and 9 ones) or nineteen… next we say:
2 tens or twenty, and show this on the a new line…
For me, this structure is much easier to see in a chart that begins at 0, rather than 1.
We are novice learners of Base 4, just as our Foundation and Year 1 students are novice learners in Base 10, so I think the grouping structure is clearer on a 0-99 chart (but we also need to take the opportunity to explicitly show how the counting chart links to place value in this way).
So long story short, when investigating the link between 2-digit place value and counting, 0-99 charts are my preferred representation. That is not to say that I don't use 1-100 charts, or 1-120 charts, or 0-199 charts. I have used them all in my classroom, at different points, to highlight different ideas, patterns or concepts.
For me, this is the key. Thinking deeply about the manipulatives or models we use so we select those that most clearly represent what we are wanting to show our students (even then there is no guarantee they will see what we are seeing- it heavily depends on their prior knowledge and experiences!), but we can increase our chances!
This week I encourage you to think about your classroom counting chart, consider your purpose for using the chart, and if you are looking at 2-digit place value or just place value in general even with Year 2-6 students, consider how the 0-99 chart might allow you to explore base ten in a little more depth.
Have a great week!
Ange🎲🎓
P.S. You can download the PDF version of this blog to print or share with colleagues here.
